This is a viewer only at the moment see the article on how this works.
To update the preview hit Ctrl-Alt-R (or ⌘-Alt-R on Mac) or Enter to refresh. The Save icon lets you save the markdown file to disk
This is a preview from the server running through my markdig pipeline
Tuesday, 04 November 2025


NOTE: THis article is primarily AI generated as part of my nuget package as release documentation. It's pretty interesting so I put it here but if that's a problem for you please ignore it.
As part of my Nuget package LLMApi / mostlylucid.mockllmapi I needed to have a page to enable using the SignalR features it has (it can simulate SignalR feeds using LLMs to provide data). So this is what i came up with.
You can find the GitHub here for the project, all public domain etc...
It quicly became quite a nice tool!
If you've ever needed to build a dashboard or real-time UI before the actual data source exists, you know the challenge. You end up writing hardcoded JSON fixtures or elaborate setInterval() loops that rotate through the same handful of objects.
I built this SignalR demo to solve that problem in a more flexible way. You describe what data you need in plain English, and a local LLM generates realistic, varied JSON that streams to your browser in real-time. No fixtures to maintain, no seed files to update, just describe what you want and watch it flow.
Let me show you how it works and how to get the most out of it.
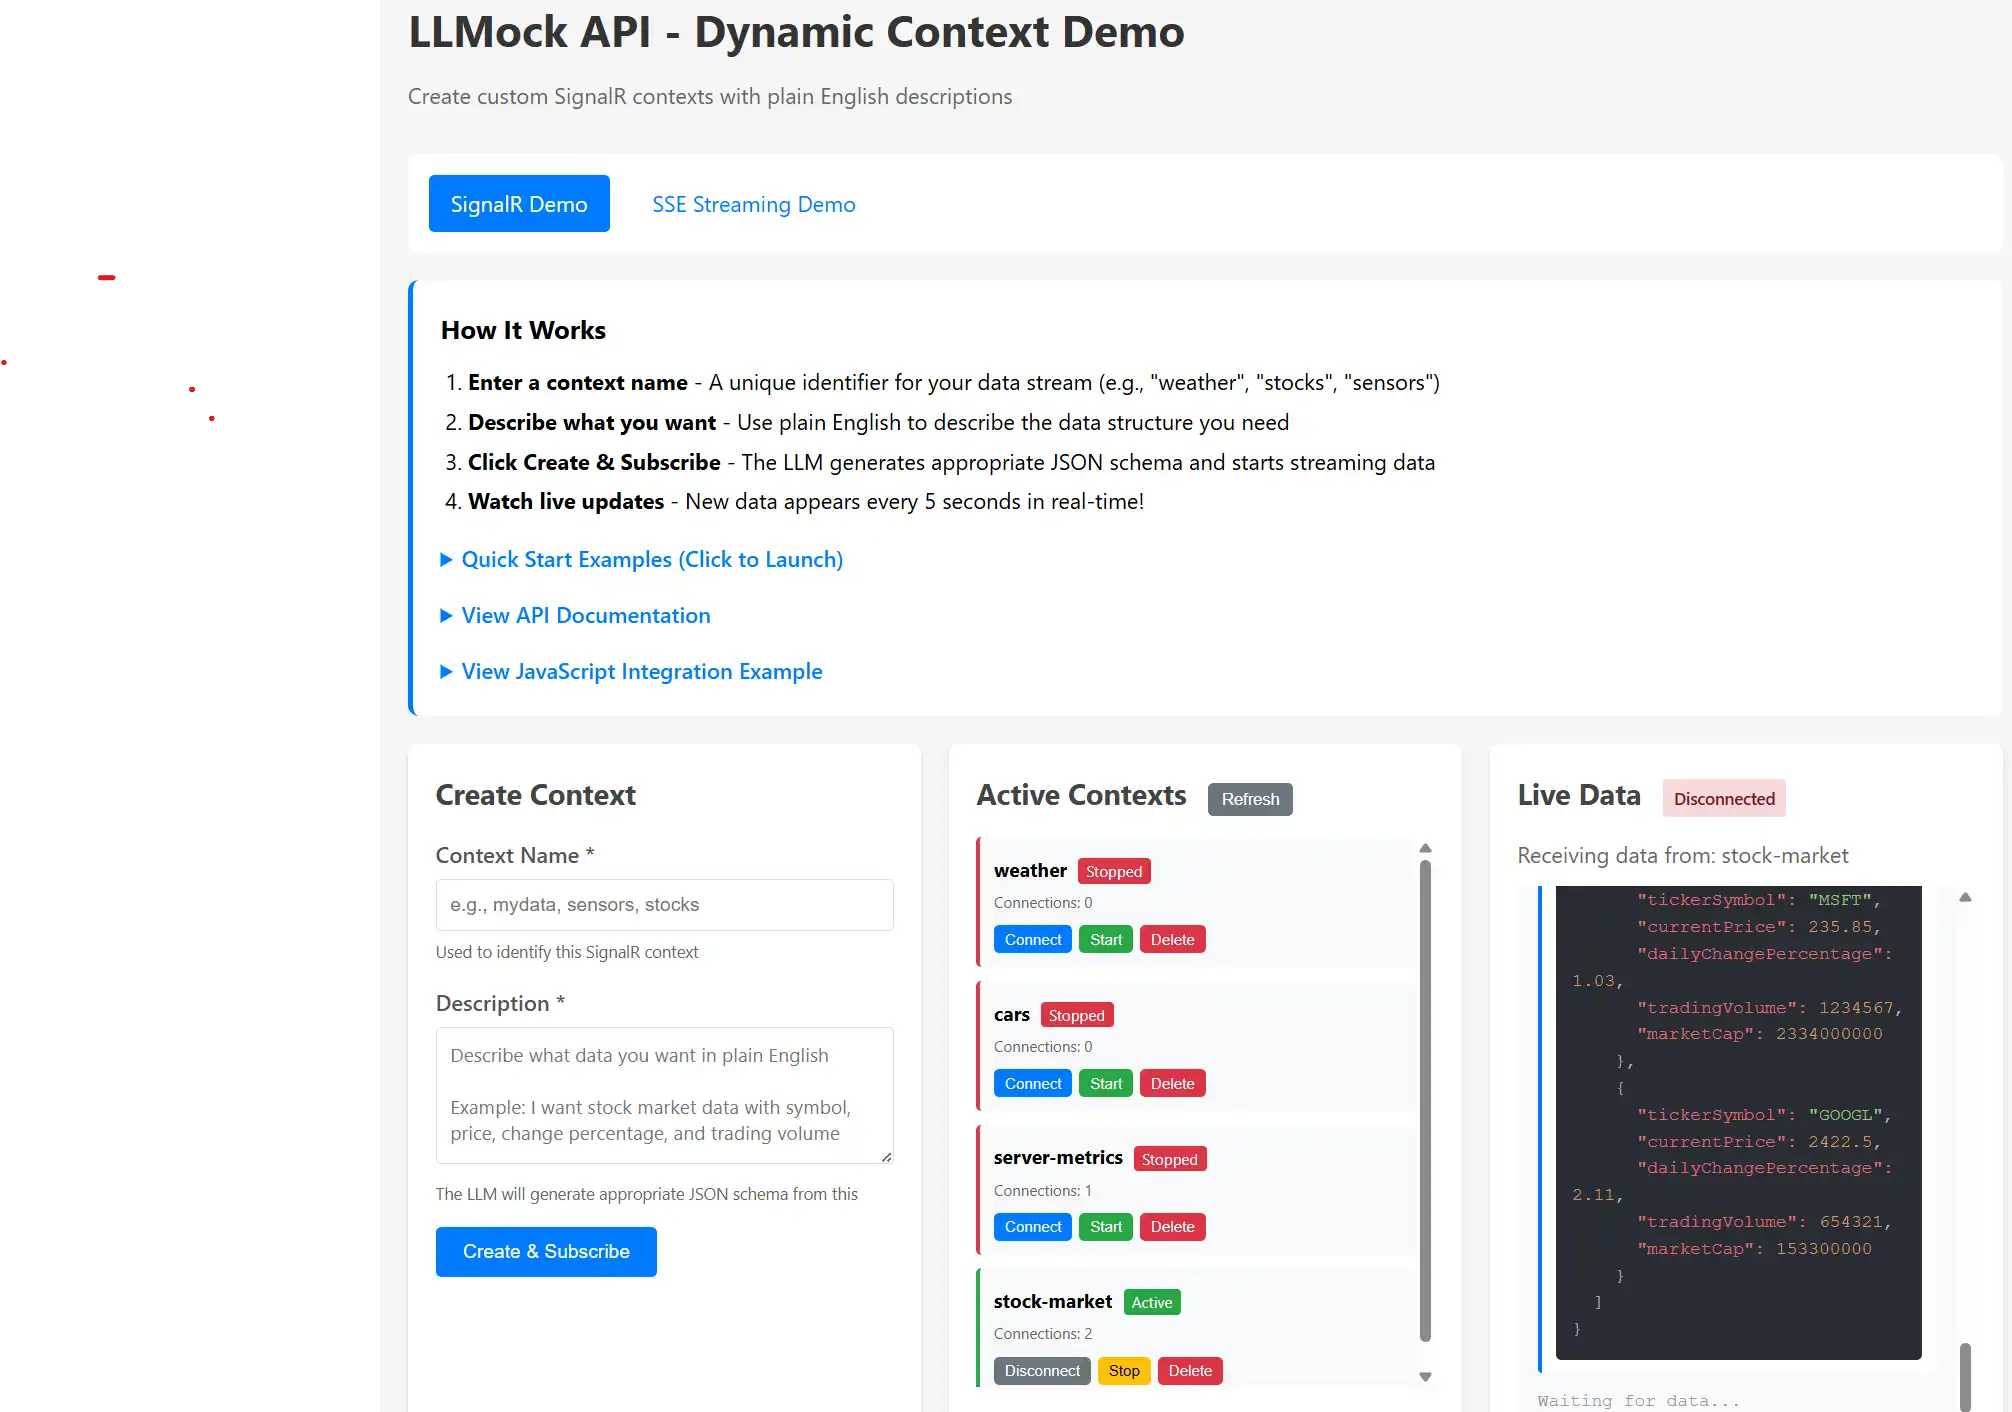
The SignalR demo page (Index.cshtml) is a control panel for managing real-time data streams. Here's the basic flow:
It's particularly useful when you're prototyping, building demos, or working on frontend features while waiting for backend APIs to be ready. The data looks realistic because the LLM understands context and generates appropriate values.
graph TB
    Browser[Your Browser]
    UI[Demo UI]
    API[Management API]
    Hub[SignalR Hub]
    Manager[Context Manager]
    BG[Background Service]
    LLM[LLM Ollama/OpenAI]
    Cache[Response Cache]

    Browser -->|Create Context| API
    API -->|Store Config| Manager
    Browser -->|Connect Subscribe| Hub
    Hub -->|Register Client| Manager
    BG -->|Generate Data| LLM
    LLM -->|Return JSON| BG
    BG -->|Cache Responses| Cache
    BG -->|Push to Clients| Hub
    Hub -->|Real-time Updates| Browser
SignalR maintains a persistent WebSocket connection between your browser and the server. Instead of polling an endpoint every few seconds with HTTP requests, the server pushes data when it's ready. This gives you truly real-time updates with minimal overhead.
The connection stays open, data flows instantly, and your UI feels much more responsive. It's the same technology used in chat applications, live dashboards, and collaborative tools where instant updates matter.
Let's start with the fastest path to see this working. I'll show you a stock market data example.
Step 1: Start the application
dotnet run --project LLMApi/LLMApi.csproj
Navigate to http://localhost:5116 (check the console output for the actual port).
Step 2: Use a Quick Start example
You'll see five pre-configured examples with green "Launch" buttons. Click "Stock Market" and you're done. The page automatically:
Step 3: Watch the data stream
Every 5 seconds, new data appears with syntax highlighting. Each update shows different stocks with realistic prices and trading volumes. The LLM generates fresh data each time, so you see variety while maintaining consistent structure.
That's it! You're now streaming mock stock market data. Feel free to explore the other quick start examples to see different data patterns.
The quick start buttons are handy, but the real power comes from describing exactly what you need. Let's create a custom example.
Example: Coffee machine telemetry
Say you're building an IoT dashboard and need simulated coffee machine data. Here's how:
Context Name: coffee-machines
Description: Coffee machine telemetry with machine ID, beans remaining percentage,
             water temperature in Celsius, cups brewed today, and last maintenance timestamp
Click "Create & Subscribe" and you're off.
sequenceDiagram
    participant Browser
    participant API
    participant Manager
    participant BG as Background Service
    participant LLM
    participant Hub

    Browser->>API: POST /api/mock/contexts<br/>{name, description}
    API->>Manager: Store context config
    Manager-->>API: Context created ✓
    API-->>Browser: 200 OK

    Browser->>Hub: invoke('SubscribeToContext', 'coffee-machines')
    Hub->>Manager: Register subscription
    Manager-->>Hub: Subscription confirmed
    Hub-->>Browser: on('Subscribed')

    Note over BG,LLM: Every 5 seconds...
    BG->>LLM: Generate data for 'coffee-machines'<br/>Prompt includes description
    LLM-->>BG: JSON response
    BG->>Hub: Broadcast to 'coffee-machines' group
    Hub-->>Browser: on('DataUpdate', {data})
    Browser->>Browser: Display with syntax highlighting
The system:
You'll see output like this:
{
  "machineId": "CM-2847",
  "beansRemaining": 67,
  "waterTemp": 94.5,
  "cupsBrewed": 142,
  "lastMaintenance": "2025-01-03T08:23:00Z"
}
Each update has different values but maintains the structure. The LLM understands "coffee machine telemetry" and generates numbers that make sense in that context.
A context is a named data stream configuration. Think of it as a channel or topic.
When you create one, you specify:
weather, stock-market, sensors)The backend then:
Multiple browsers can subscribe to the same context and they all receive the same data simultaneously. This is great for testing dashboards that need to show synchronized updates across different screens or components.
stateDiagram-v2
    [*] --> Created: Create Context<br/>(POST /contexts)

    Created --> Active: Start<br/>(auto or manual)
    Active --> Stopped: Stop<br/>(POST /stop)
    Stopped --> Active: Start<br/>(POST /start)

    Created --> Subscribed: Client Subscribes
    Active --> Subscribed: Client Subscribes
    Stopped --> Subscribed: Client Subscribes<br/>(no data sent)

    Subscribed --> Receiving: Data Push<br/>(if Active)
    Receiving --> Subscribed: Client Connected

    Subscribed --> Created: Unsubscribe
    Subscribed --> Active: Unsubscribe
    Subscribed --> Stopped: Unsubscribe

    Created --> [*]: Delete
    Active --> [*]: Delete
    Stopped --> [*]: Delete
    Subscribed --> [*]: Delete

    note right of Active
        Generates data
        Pushes to clients
        Shows "Active" badge
    end note

    note right of Stopped
        No data generation
        Clients stay connected
        Shows "Stopped" badge
    end note
The interface has three panels to keep things organized:
This is where you define new data streams. You'll need:
You don't need to write JSON schemas or explain data types. The LLM infers structure from natural language descriptions surprisingly well.
Shows all your running contexts with:
Connect/Disconnect controls your browser's subscription. Click Connect to start receiving data, Disconnect to stop without deleting the context.
Start/Stop controls backend data generation. This is useful when you want to pause a stream without destroying the context configuration.
Delete removes the context entirely. Use this to clean up when you're done with a particular data stream.
This is where you see real-time updates:
Data appears newest-first at the top, so you always see the latest updates without scrolling.
The page uses HTMX for form submission and SignalR for real-time connectivity. If you're building your own client, here's the SignalR pattern you'll need:
sequenceDiagram
    participant Page as Your Page
    participant SR as SignalR Client
    participant Hub as /hub/mock
    participant BG as Background Service

    Page->>SR: new HubConnectionBuilder()<br/>.withUrl('/hub/mock')
    Page->>SR: connection.start()
    SR->>Hub: WebSocket connection
    Hub-->>SR: Connected ✓
    SR-->>Page: Trigger 'connected' event

    Page->>SR: invoke('SubscribeToContext', 'weather')
    SR->>Hub: SubscribeToContext('weather')
    Hub->>Hub: Add to 'weather' group
    Hub-->>SR: on('Subscribed', {context: 'weather'})
    SR-->>Page: Display "Subscribed"

    loop Every 5 seconds
        BG->>Hub: Broadcast to 'weather' group
        Hub->>SR: on('DataUpdate', {data, timestamp})
        SR->>Page: Update UI with new data
    end

    Page->>SR: invoke('UnsubscribeFromContext', 'weather')
    SR->>Hub: UnsubscribeFromContext('weather')
    Hub->>Hub: Remove from 'weather' group
Setting up the connection:
const connection = new signalR.HubConnectionBuilder()
    .withUrl('/hub/mock')
    .withAutomaticReconnect()
    .build();

connection.on('DataUpdate', (message) => {
    // message.context: which context sent this
    // message.data: the actual JSON payload
    // message.timestamp: Unix timestamp in milliseconds
});

await connection.start();
Subscribing to receive data:
await connection.invoke('SubscribeToContext', 'my-context-name');
Unsubscribing when finished:
await connection.invoke('UnsubscribeFromContext', 'my-context-name');
The demo page handles all this automatically, but these three patterns are all you need for a custom implementation.
Here are some scenarios where this tool really shines:
1. Building UIs Before APIs Exist
You're working on a dashboard and the backend team is still designing the API schema. Instead of blocking on their work, describe the data structure you expect and build your UI against the mock stream. When the real API is ready, you'll just swap the endpoint.
2. Client Demonstrations
You're demoing a live monitoring dashboard to a client, but the actual data pipeline isn't ready yet. Create contexts that match your planned data structure and show realistic, changing data during the presentation. It looks professional and helps the client visualize the final product.
3. Frontend Development and Testing
You need realistic, varied data to test how your charts, tables, and components handle updates. Create contexts with the structures you need and develop your UI with confidence that it handles real-world data patterns.
4. Load Testing Real-Time Features
You want to see how your UI performs under rapid updates. Create a high-frequency context and watch how your components handle the data flow. This helps identify performance issues before production.
5. Teaching WebSockets and Real-Time Concepts
You're teaching SignalR or WebSocket concepts and want students to see real-time updates without building a complete backend. The demo provides a working example they can experiment with and learn from.
The five pre-configured examples demonstrate different common data patterns:
IoT Sensors: Numeric sensor readings with device metadata Stock Market: Financial data with prices, volumes, and percentage changes E-commerce Orders: Nested objects with order items arrays Server Metrics: System monitoring with multiple performance metrics Gaming Leaderboard: Player rankings with stats and statuses
These examples are ready to go. Click Launch, watch the data, and use them as templates for your own contexts.
If you're building a custom client or integrating this into another application, here are the HTTP endpoints:
Create a context:
curl -X POST http://localhost:5116/api/mock/contexts \
  -H "Content-Type: application/json" \
  -d '{"name": "sensors", "description": "Temperature sensors with device ID and readings"}'
List all contexts:
curl http://localhost:5116/api/mock/contexts
Get a specific context:
curl http://localhost:5116/api/mock/contexts/sensors
Start or stop data generation:
curl -X POST http://localhost:5116/api/mock/contexts/sensors/start
curl -X POST http://localhost:5116/api/mock/contexts/sensors/stop
Delete a context:
curl -X DELETE http://localhost:5116/api/mock/contexts/sensors
After creating a context, connect to the SignalR hub at /hub/mock and subscribe to start receiving updates.
When you create a context, the system:
The temperature is set to 1.2 (relatively high) to ensure variety. When you ask for "user data," you get different names and values each time, not the same few recycled endlessly. The data stays structurally consistent while varying realistically.
Data generation happens in the background, not on-demand per push. This keeps updates consistent and reduces LLM load.
Here's how it works:
Result: Your first message arrives instantly, subsequent messages come consistently every 5 seconds, and the LLM isn't being hammered continuously.
graph LR
    subgraph Startup
        A[App Starts] --> B[Pre-fill Cache]
        B --> C[Measure Gen Time<br/>500ms]
        C --> D[Calculate Batch<br/>5000ms / 500ms = 10]
    end

    subgraph Runtime Loop
        E[Timer Tick<br/>Every 5s] --> F{Cache > 50%?}
        F -->|Yes| G[Pop from Cache]
        F -->|No| H[Generate Batch<br/>in Background]
        G --> I[Push to Clients]
        H --> J[Refill Cache]
        J --> G
        I --> E
    end

    D --> E

    style B stroke:#10b981,stroke-width:3px
    style G stroke:#0ea5e9,stroke-width:3px
    style H stroke:#ef4444,stroke-width:3px
    style I stroke:#f59e0b,stroke-width:3px
Connection shows "Disconnected" and won't reconnect
http://localhost:11434ollama list to verify you have models installedContext created but no data appearing
Data structure doesn't match what you expected
Browser console shows SignalR reconnection attempts
You can customize behavior in appsettings.json:
{
  "MockLlmApi": {
    "SignalRPushIntervalMs": 5000,  // How often to push data (milliseconds)
    "ModelName": "llama3",           // Which LLM model to use
    "Temperature": 1.2,              // Creativity level (0.0-2.0, higher = more varied)
    "BaseUrl": "http://localhost:11434",  // LLM service URL
    "HubContexts": [                 // Optional: pre-configured contexts
      {
        "Name": "weather",
        "Description": "Weather data with temperature, humidity, wind speed",
        "IsActive": true
      }
    ]
  }
}
SignalRPushIntervalMs: Set lower for faster updates, higher to reduce LLM load Temperature: Higher values give more creative/random data, lower gives more consistent results HubContexts: Define contexts that start automatically when the application launches
If you're building an actual dashboard and want to use this during development, here's a React example:
import * as signalR from '@microsoft/signalr';

const connection = new signalR.HubConnectionBuilder()
  .withUrl('http://localhost:5116/hub/mock')
  .withAutomaticReconnect()
  .build();

connection.on('DataUpdate', (message) => {
  if (message.context === 'stock-market') {
    updateStockChart(message.data);
  }
});

await connection.start();
await connection.invoke('SubscribeToContext', 'stock-market');
When you're ready to switch to production, just change the hub URL. The SignalR interface (on() and invoke()) works the same way with real backends.
There are good mock data libraries out there. Faker.js is excellent. Mockaroo does great work. So why build another tool?
This tool solves specific challenges:
It's designed for a specific workflow: building real-time UIs when you need varied, realistic data without configuration overhead.
The best way to understand this tool is to use it:
dotnet run --project LLMApihttp://localhost:5116From there, try creating your own context with a description that matches your project's needs. The tool is most valuable when you use it for real development work.
I built this because I kept running into the same problem: needing realistic, changing data for demos and development. If you face that challenge too, I hope this tool helps your workflow.
Starting up:
dotnet run --project LLMApi
Default URL: http://localhost:5116
SignalR Hub: /hub/mock
Key Methods:
SubscribeToContext(name) - Start receiving dataUnsubscribeFromContext(name) - Stop receiving dataKey Events:
DataUpdate - New data arrivedSubscribed - Subscription confirmedUnsubscribed - Unsubscription confirmedThat's everything you need to know. The rest is just exploring what you can build with it.
© 2026 Scott Galloway — Unlicense — All content and source code on this site is free to use, copy, modify, and sell.
